LaTeX templates and examples — Charts
LaTeX can be used to produce a variety of different charts and diagrams, including: flowcharts, gantt charts, pie charts, branching and decision trees, family trees, histograms, bar charts and more. If you're looking for a particular type of chart that isn't featured here, please let us know, or submit your own example to the gallery.
Recent
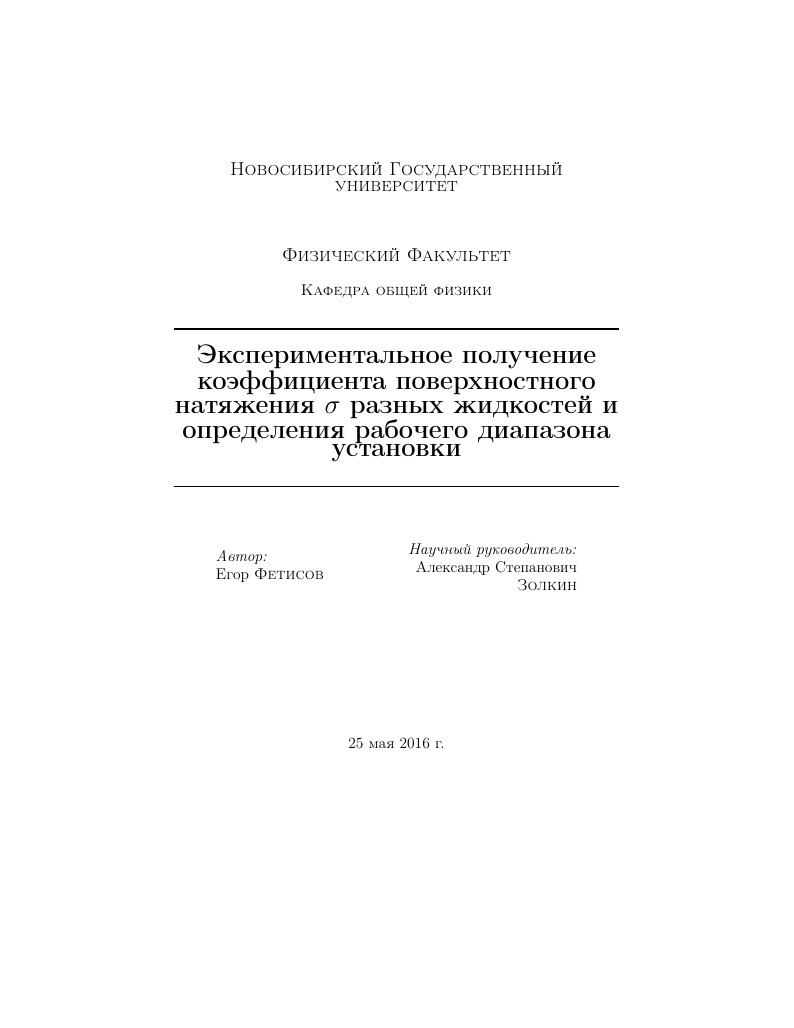
В данной работе представлено экспериментальное получение коэффициента поверхностного натяжения(КПН) жидкости. Также проверяется зависимость КПН от температуры. Устанавливается рабочий диапазон установки. В работе приводится разбор экспериментов проведанных автором работы. Исследовалось несколько видов жидкостей. Неорганические жидкости: Вода, Органические жидкости: Глицерин. Измерения проводились при температурах: 25 и 45, 50 градусов Цельсия.

With this simple LaTeX template you can quickly create and share your family tree online with friends and relatives. For help with different styles, see this guide to trees in LaTeX on the excellent LaTeX Community forum, and you can find help with using the TikZ package in Part 3 of our free Introduction to LaTeX course.
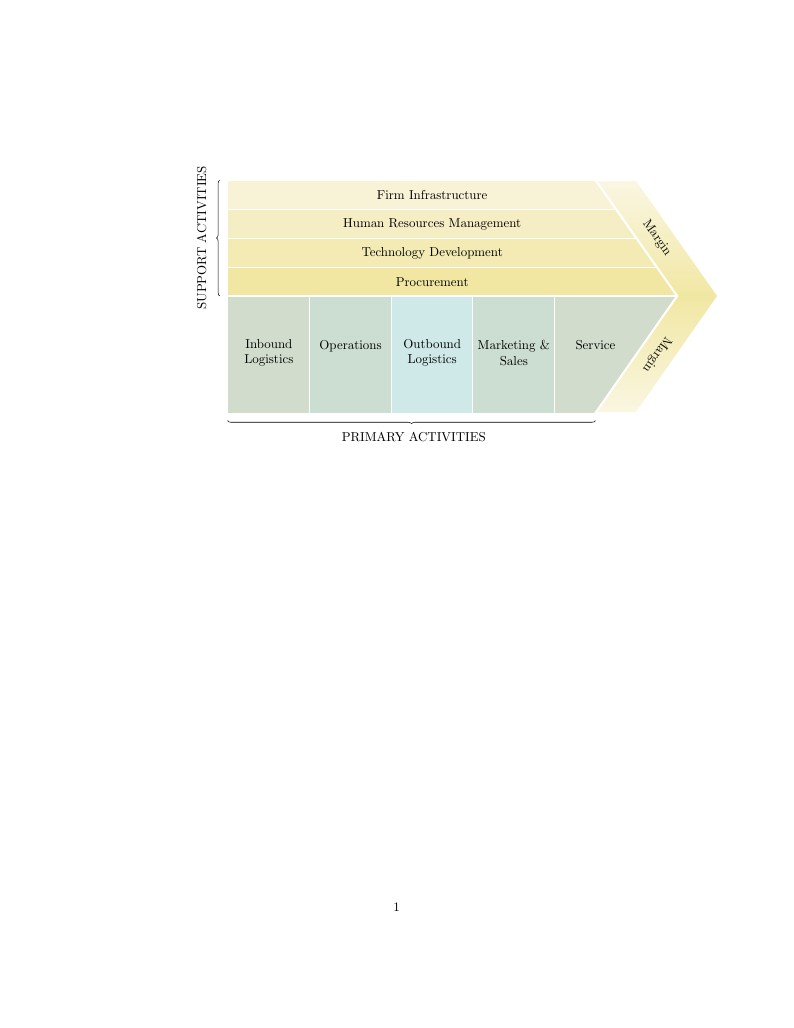
The Porter Value Chain as an example of a table in the shape of an arrow, by Gonzalo Medina. Source: http://tex.stackexchange.com/questions/112579/table-in-the-shape-of-an-arrow/112681#112681
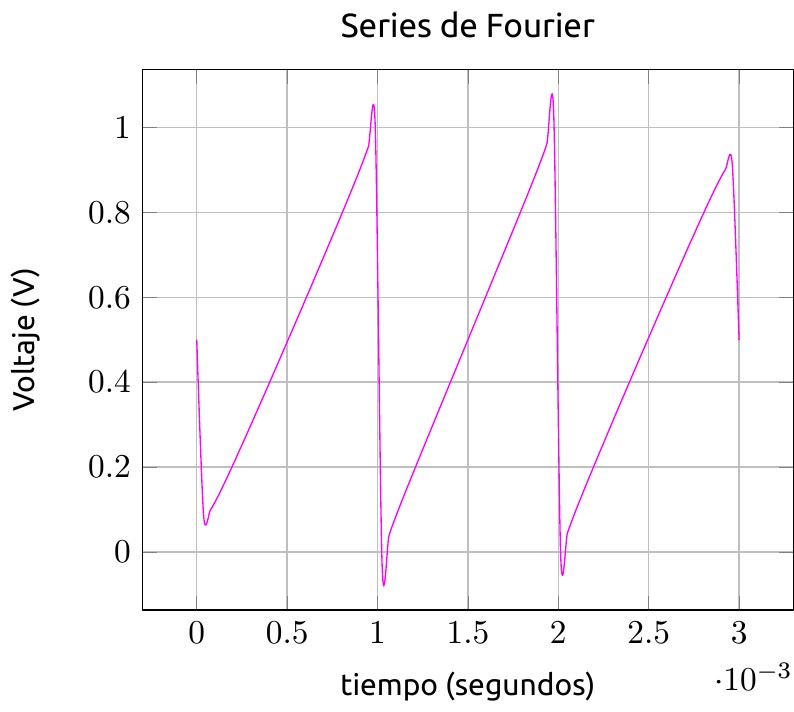
Este ejemplo demuestra como se puede sintetizar una señal periódica de "diente de sierra" partiendo de las Series de Fourier, utilizando sumas de funciones senoidales que van desde la que tiene la frecuencia fundamental de la señal hasta sus armónicas. Para ello se usa el paquete pgfplots y el comando \pgfplotsinvokeforeach{,...,} y luego se suma de forma acumulativa para formar la función \sumacurva, definida como una variable que parte del cero (0).
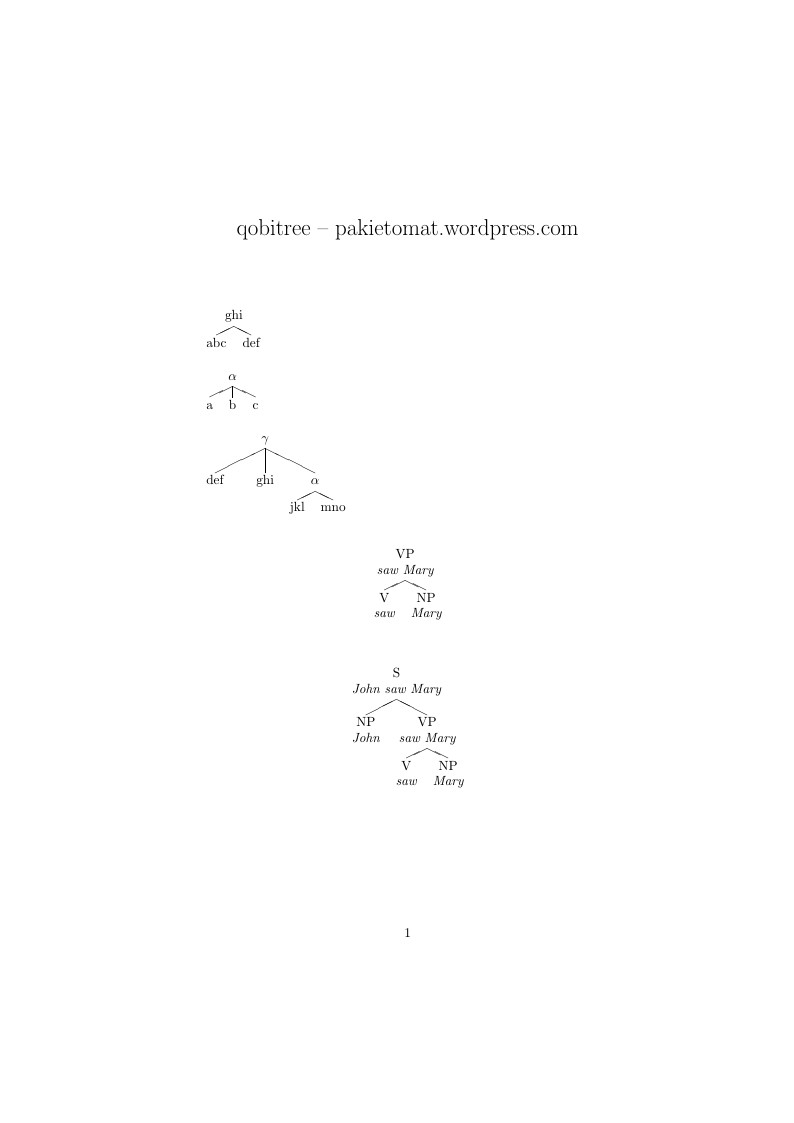
Pakiet umożliwia robienie prostych grafów. Jest prosty i efektowny w działaniu. Kolejne polecenia \leaf umieszczają na stosie swoje parametry, a polecenia \branch zdejmują ze stosu wskazaną pierwszym argumentem liczbę obiektów i łączą je ukośnymi liniami; graf jest budowany w odwrotnej kolejności.
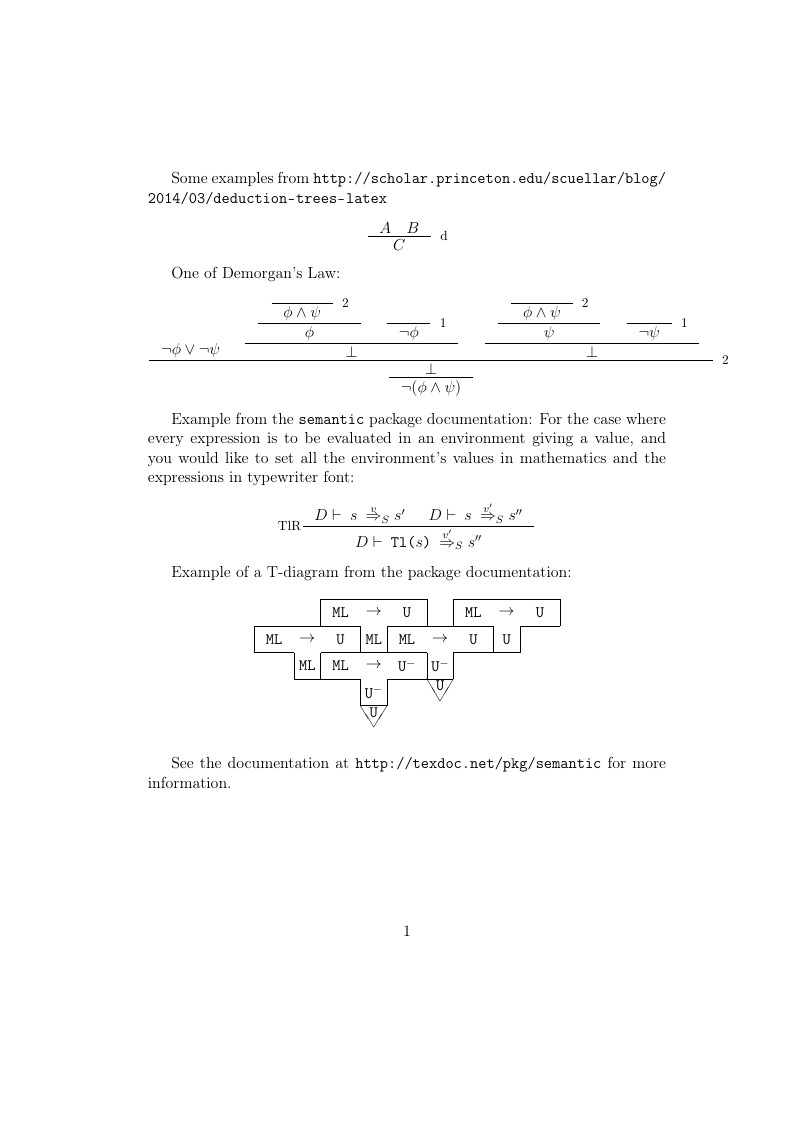
Some examples of typesetting inference rules and T-diagrams using the semantic package.
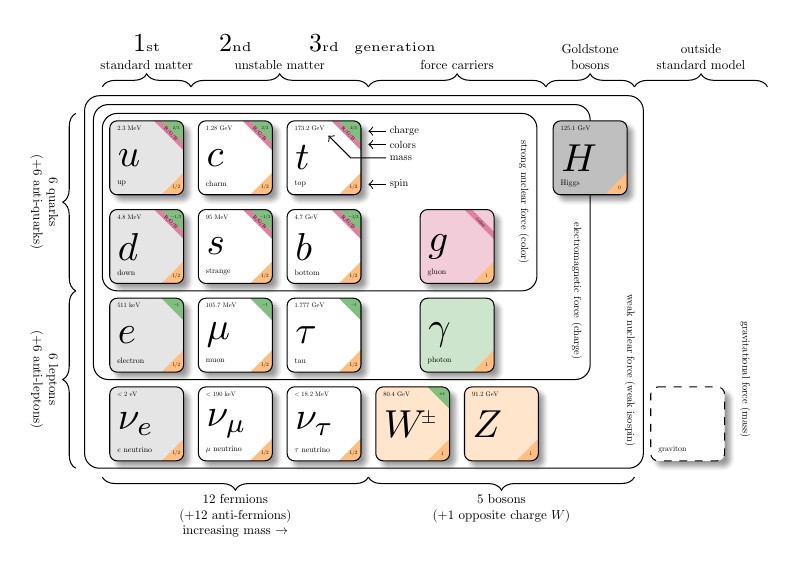
Chart of subatomic particles
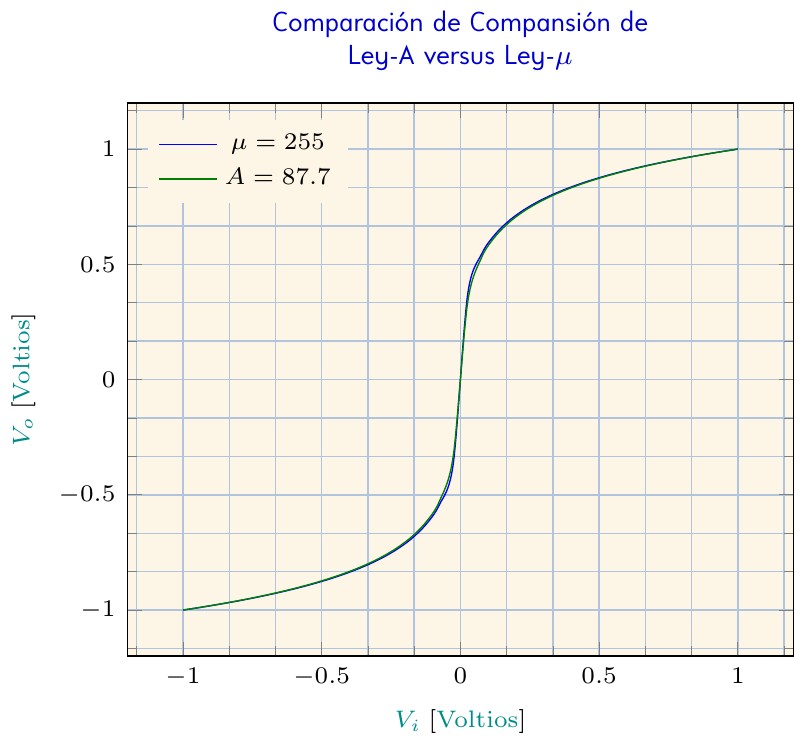
Este gráfico presenta las comparaciones de la compansión de una señal telefónica de entrada cuando es comprimida usando la Ley-A y la Ley-Mu tal se describen en la Recomendación G.711 de la Unión Internacional de Telecomunicaciones. De la gráfica se deduce que la compansión con ambas leyes no presenta mayores diferencias.
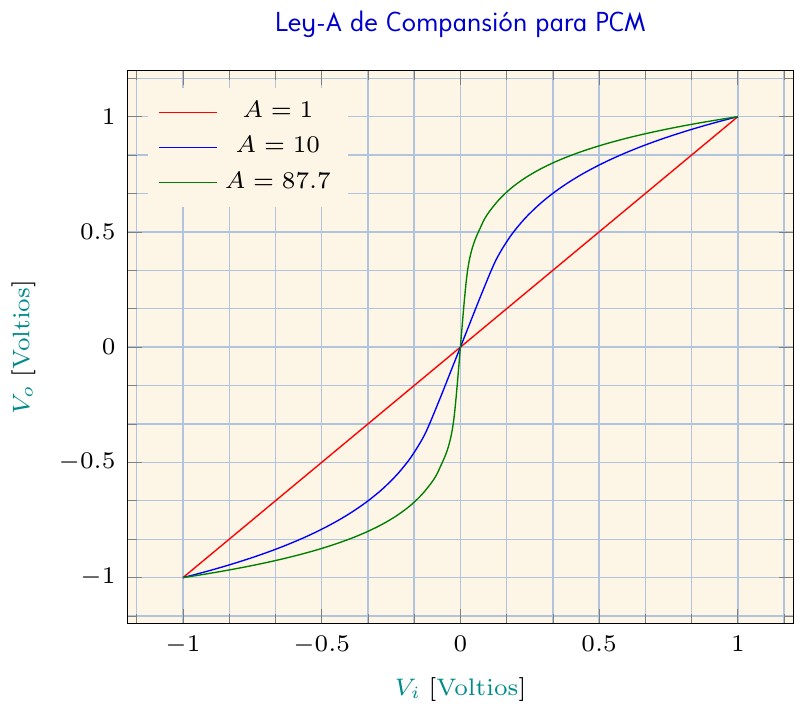
Este gráfico presenta las características de compresión de una señal telefónica de entrada cuando es comprimida usando la Ley-A tal como es descrita en la Recomendación G.711 de la Unión Internacional de Telecomunicaciones. Esta Ley es descrita por la siguiente ecuación: f(x)=sign(x)*\begin{cases} \displaystyle \frac{A\left |{x}\right |}{1+ln(A)} &\text{si} \, \displaystyle\left |{x}\right | < \frac{1}{A} \\ \\ \displaystyle \frac{1+ln(A\left |{x}\right |)}{1+ln(A)}&\text{si} \, \displaystyle \frac{1}{A} \leq\left |{x}\right |\leq 1 \end{cases}
\begin
Discover why over 30 million people worldwide trust Overleaf with their work.